Company Overview, Sales Performance and Expense Performance
The Management Reports column of the Reports module holds three views built for the owner rather than the accountant. Company Overview puts income, expense and margin for a period beside the previous year, with top customers, top suppliers and condensed statements on one screen. Sales Performance ranks customers by invoice value and share. Expenses Performance does the same for suppliers. This article covers all three.
On this page
- Opening a management report
- Company Overview
- Sales Performance
- Expenses Performance
- Frequently asked questions
Opening a management report
- Open the client and select Reports.
- In the Management Reports column, select View beside the report.
Company Overview
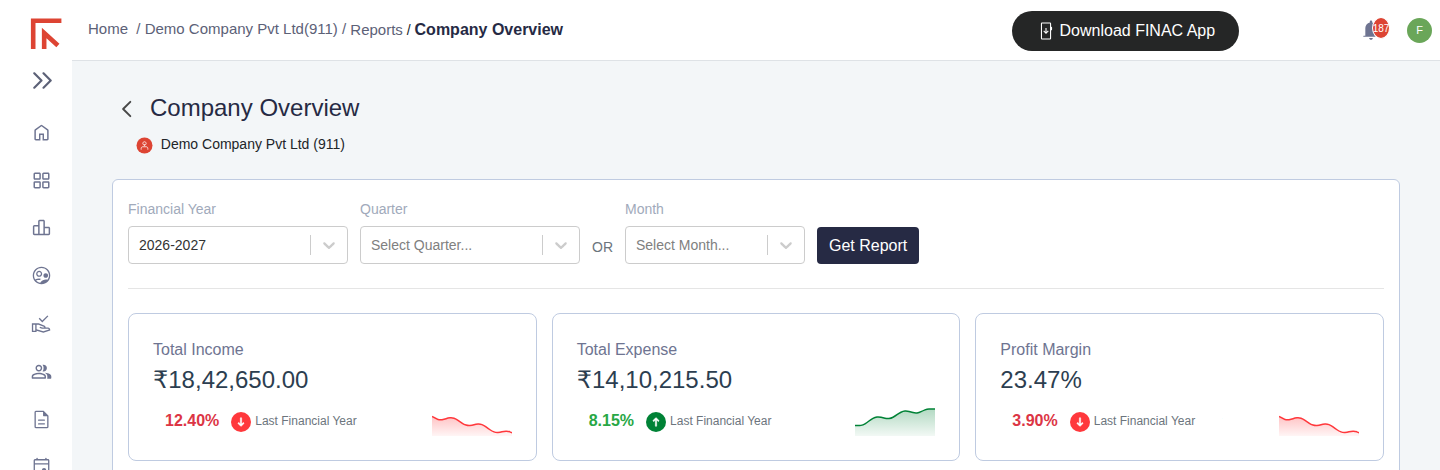
Choose a Financial Year and, optionally, a Quarter or a Month, then select Get Report. The page is laid out in four parts.
| Part | What it shows |
|---|---|
| Headline cards | Total Income, Total Expense and Profit Margin for the selected period, each with the percentage change against the same period last financial year and a small trend line. |
| Top customers and suppliers | Bar charts of the highest-value customers and suppliers by invoice value for the period. View All opens the full ranking in Sales Performance or Expenses Performance. |
| Top income and expense ledgers | The ledgers carrying the most income and expense, which shows where the business earns and spends. |
| Profit & Loss and Balance Sheet | Condensed versions of the two statements for the period, grouped by account type, each with a View All link to the full report. |
The comparison to last financial year is calculated on the same period: a quarter against the same quarter, a month against the same month. For a new client with no prior-year data the percentage is shown against zero and can be ignored until a full year has been recorded.
Sales Performance
Set the Date range and select Get Report. Each row is a customer with its GSTIN, the total invoice value in the period, the number of invoices and its share of total sales.
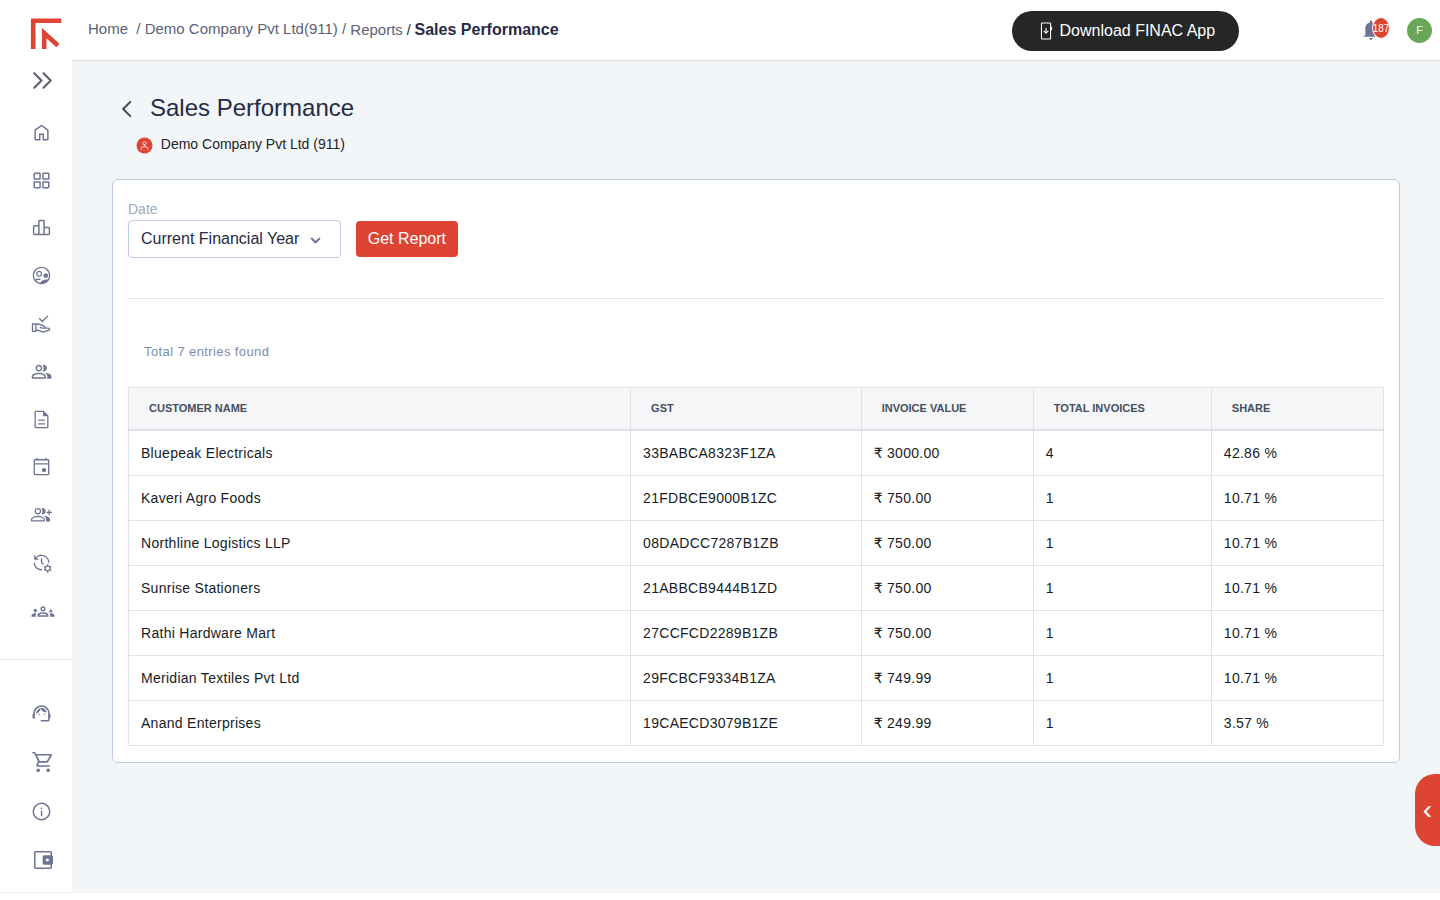
The share column makes concentration visible. A single customer above a third of sales, as in the example, is a dependency worth knowing about; a long tail of small customers points the other way. Compare two periods to see whether the mix is shifting.
Expenses Performance
Expenses Performance has the same layout for suppliers: supplier name and GSTIN, total bill value, number of bills and share of total expenses for the period. Use it to see which suppliers account for most of the spend, to check that a supplier's volume matches the terms negotiated with them, and to spot a supplier whose share is growing faster than the business.
Frequently asked questions
Do the management reports include unapproved entries?
Yes. They read the same ledgers as the financial statements, so an entry appears as soon as it is recorded. Approve entries promptly if the reports are used for decisions.
Why does Sales Performance total differ from the Profit & Loss income?
Sales Performance sums invoice values including GST; the Profit & Loss shows income net of tax. Non-invoice income, such as interest, appears only in the Profit & Loss.
Can I export these reports?
Yes. Each report has the Excel download icon at the top right of the table.