Detailed Statements and Income and Expense Analysis
The Trial Balance, Profit and Loss and Balance Sheet give the position in summary. Six further reports under Reports → Financials open those summaries up: the Detailed Profit & Loss, Detailed Balance Sheet and Detailed Trial Balance show every ledger under each heading; Trading, Profit & Loss separates gross profit from net; the Receipt & Payment Account follows cash and bank rather than income and expense; and the Detailed Income and Expense Analysis compares this year with last, line by line. This article explains what each adds, how to run it, and which question it answers.
On this page
- Which report to reach for
- Detailed Profit & Loss, Balance Sheet and Trial Balance
- Trading, Profit & Loss
- Receipt & Payment Account
- Detailed Income and Expense Analysis
- Frequently asked questions
Which report to reach for
| Question | Report |
|---|---|
| Which accounts make up Indirect Expenses this year? | Detailed Profit & Loss |
| Which suppliers and tax ledgers sit behind the Balance Sheet totals? | Detailed Balance Sheet |
| Opening, movement and closing for every ledger, grouped by type | Detailed Trial Balance |
| What is the gross margin after cost of goods sold, before overheads? | Trading, Profit & Loss |
| Where did cash come from and go to, by bank and cash account? | Receipt & Payment Account |
| Which income or expense lines moved most against last year, or last quarter? | Detailed Income and Expense Analysis |
All six run for the current or previous financial year from the Date control, and the Excel icon on each downloads the table exactly as shown. The Detailed Profit & Loss and Detailed Balance Sheet also take a Branch, for a single GST branch.
Detailed Profit & Loss, Balance Sheet and Trial Balance
Each detailed report has the same shape as its summary counterpart, with every group opened up to the ledgers beneath it. Select View beside the report, choose the year (and branch where offered), and select Get Report.
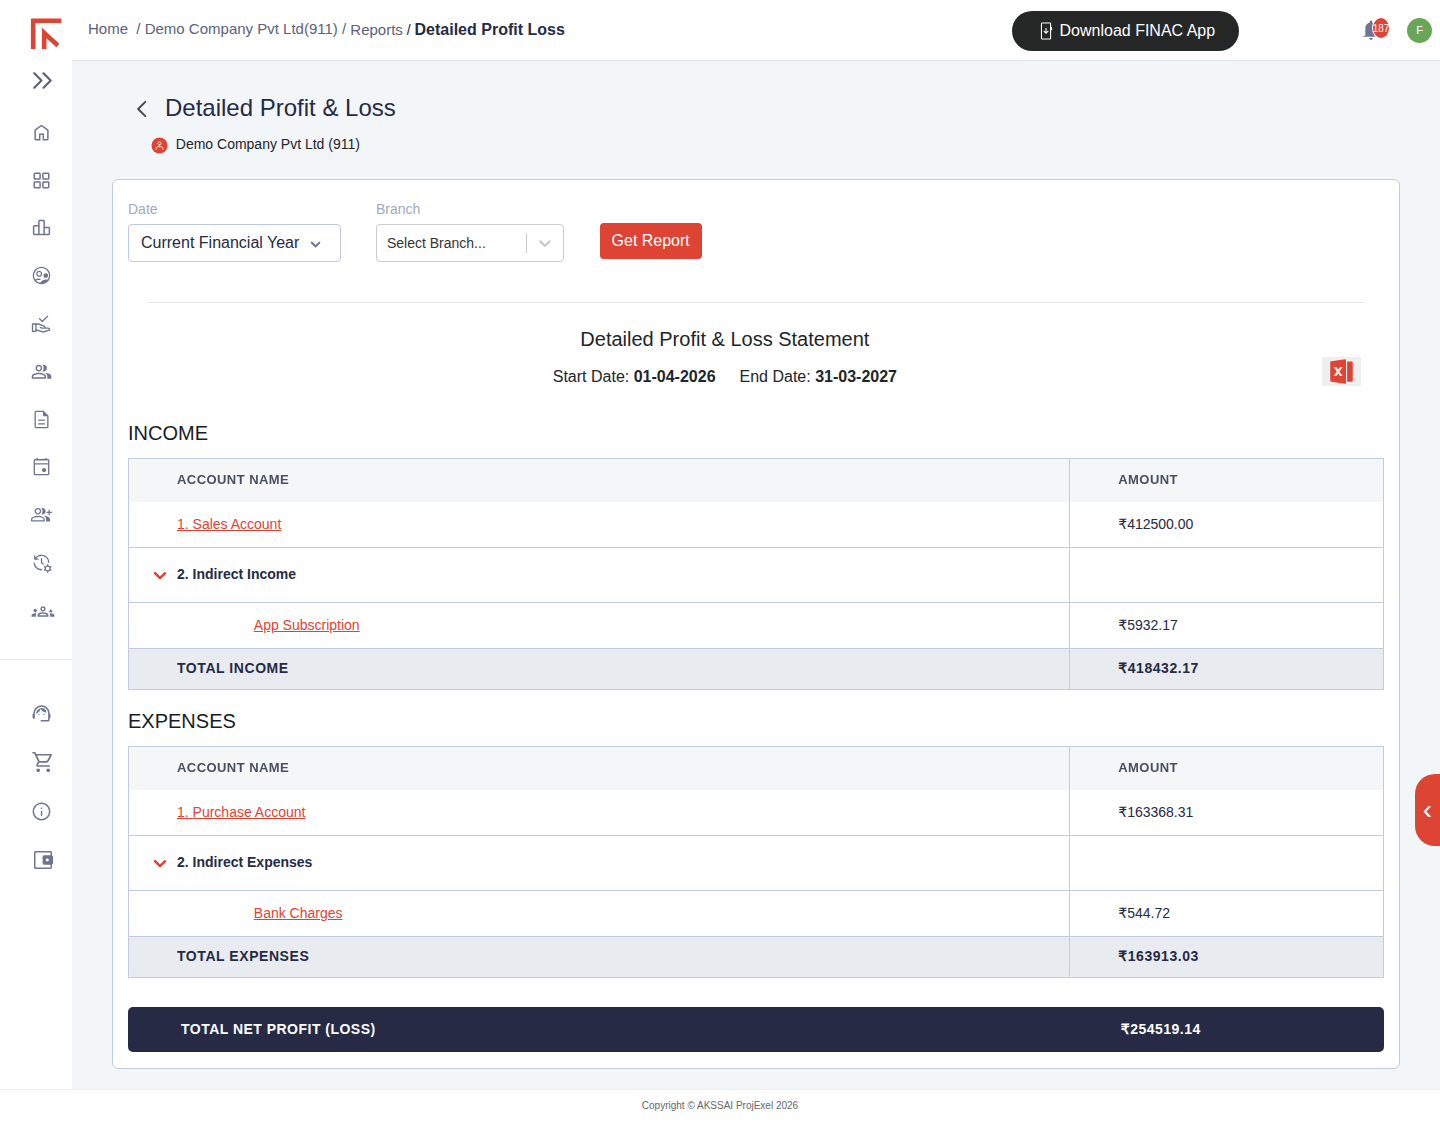
In the Detailed Profit & Loss, groups such as Indirect Income and Indirect Expenses carry a chevron; select it to expand or collapse the ledgers within. Ledger names are links that open the Ledger Statement for the same period, so a figure can be traced to its entries in two clicks. Total Income, Total Expenses and Total Net Profit (Loss) agree to the summary Profit and Loss for the same dates.
The Detailed Balance Sheet follows the same pattern across Equity, Retained Earnings, Liabilities, Tax Payable and Supplier on one side and Assets, Customer, Tax Receivable and Inventory on the other, so every customer, supplier and tax ledger is visible with its balance. Because stock is held at company level, a branch-wise Balance Sheet for a client with stock entries may not balance on its own; the report says so at the top.
The Detailed Trial Balance lists every ledger grouped by type (Equity, Liabilities, Tax Payable, Supplier, Assets, Customer, Income, Expense) with Opening Balance, Debit, Credit and Closing Balance, and a total for each group. It is the report to reconcile against an external trial balance, because it shows movement as well as balances.
Trading, Profit & Loss
For a trading or manufacturing client, the single-step Profit and Loss hides the margin on goods. Trading, Profit & Loss presents it in two stages. The trading section takes direct income and sets against it the Cost of Goods Sold, built from Opening Stock plus all direct expense ledgers less Closing Stock, to arrive at Gross Profit. The profit and loss section then adds indirect income and deducts indirect expenses to reach Total Net Profit. Opening and closing stock come from the Stock Summary, so the report is only as good as the stock records behind it: a purchase bill recorded without item lines inflates direct expenses and understates closing stock at the same time.
Receipt & Payment Account
The Receipt & Payment Account is a cash-basis statement: it ignores accruals and shows, for each bank and cash ledger, the opening balance, receipts and payments through the year, and the closing balance, with a total across all accounts. Select View, choose the year and select Get Statement.
It is the report societies, trusts and clubs are often asked to present, and for any client it is a quick check on the bank ledgers: the closing balance of each account should agree to the bank statement for the same date, and a balance on Suspense indicates bank transactions that have been uploaded but not yet posted to a party or expense ledger.
Detailed Income and Expense Analysis
This report sets the chosen period against the same period a year earlier, group by group, with the Difference and the Change in %.
- Select View beside Detailed Income And Expense Analysis.
- Choose the Financial Year. To narrow the comparison, choose a Quarter or a Month; the prior-year column then shows the matching quarter or month.
- Select Get Report.
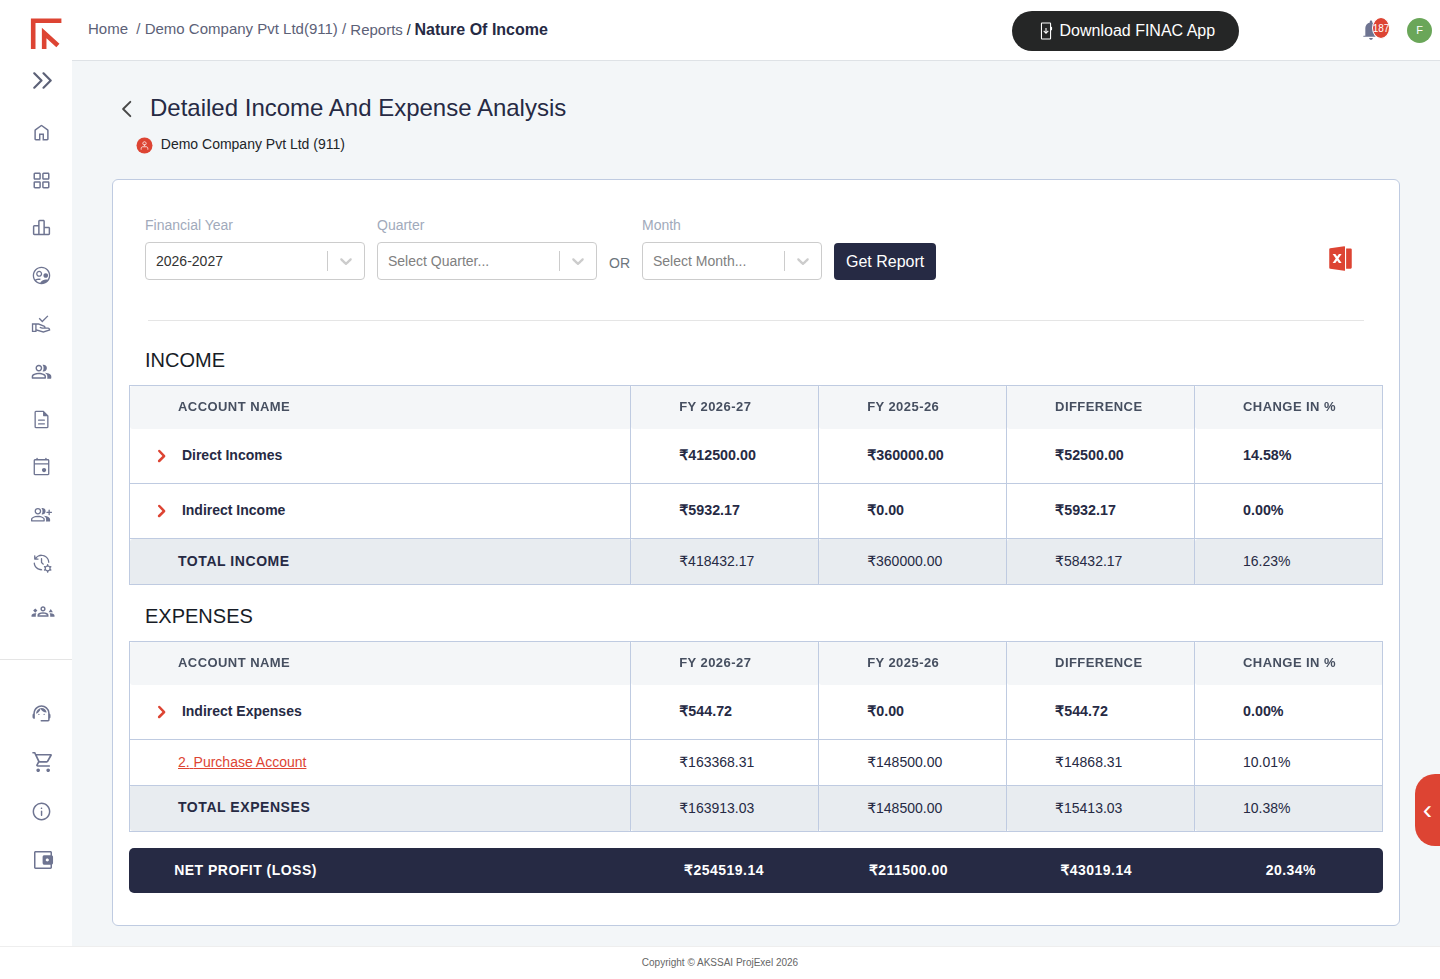
Groups expand with the chevron to show the ledgers within, so a jump in Indirect Expenses can be traced to the account that caused it. A line showing a large percentage against a small base, or 0.00% where the prior year was nil, is usually a new ledger rather than a real trend, and is worth confirming before it goes into a management report.
Frequently asked questions
The Detailed Profit & Loss and the Profit & Loss show different net figures.
Check that both were run for the same dates and branch. Run for the same period they agree; the detailed report only opens the groups, it does not change the figures.
Gross Profit in Trading, Profit & Loss is negative although the business is profitable.
Closing stock is understated, most often because purchases were recorded without item lines and so never reached stock. Correct the bills and refresh the Stock Summary; the trading account will follow.
Why is there a Suspense line in Receipts and Payments?
Bank transactions that could not be matched to a party or ledger at upload sit in Suspense until they are posted. A non-zero balance is a list of transactions still to classify, reachable from the bank statement's transaction list.
Can I compare two quarters of the same year?
The analysis compares like with like a year apart. For quarter-on-quarter within a year, download each quarter's Profit and Loss to Excel and compare there.